Graphs are a fundamental concept in computer science and mathematics that allow us to represent relationships among various entities. A graph is simply a set of connections. Consider a scenario where you and your friends are engaged in a poker game, and you need to create a representation of the debts within your group. Let’s say Rabi owes Asad some money. We can represent this relationship as follows:
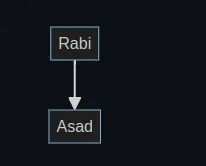
The full graph depicting who owes money to whom could look like this:
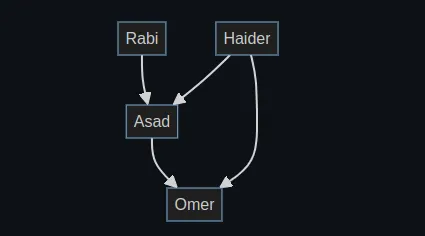
Analyzing this graph, we can deduce the following financial relationships:
- Rabi is indebted to Asad.
- Haider owes money to both Asad and Omer.
- Asad owes money to Omer.
- Omer, on the other hand, does not have any debts.
Graphs are made up of nodes and edges. A node can be directly connected to many other nodes, known as its neighbors.
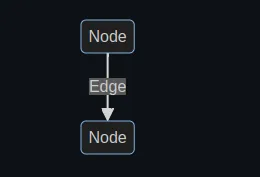
In the graph we saw above, Asad is considered Rabi’s neighbor due to their direct connection. However, Haider is not considered a neighbor to Rabi because they lack a direct connection. But Haider is considered a neighbor to both Asad and Omer due to their direct connections with him.
Representation of Graph
A graph consists of multiple nodes, each linked to its adjacent nodes. How can one effectively denote a relationship such as “Rabi -> Asad”? Let’s explore two common ways to represent this graph:
- Using a hash table
- Using an adjacency matrix
Using a Hash Table
A hash table is a perfect data structure to express relationships. It enables the establishment of associations between keys and their corresponding values. In this particular scenario, the objective is to map each node to its respective neighbors. In Python, we can represent the graph we saw earlier like this:
graph = {
    'Rabi': ['Asad'],
    'Haider': ['Asad', 'Omer'],
    'Asad': ['Omer'],
    'Omer': []
}
Say, I want to get neighbors of Haider, all I need to do is:
graph['Haider']
Using an Adjacency Matrix
An adjacency matrix is another way to represent a graph. In an adjacency matrix, rows and columns correspond to nodes, and the matrix elements indicate whether there is an edge between the nodes. For the same graph, the adjacency matrix would look like this:
# Define the nodes
nodes = ['Rabi', 'Haider', 'Asad', 'Omer']

# Initialize an empty adjacency matrix
adjacency_matrix = [[0] * len(nodes) for _ in range(len(nodes))]

# Fill in the adjacency matrix based on the edges
adjacency_matrix[0][2] = 1  # Rabi -> Asad
adjacency_matrix[1][2] = 1  # Haider -> Asad
adjacency_matrix[1][3] = 1  # Haider -> Omer
adjacency_matrix[2][3] = 1  # Asad -> Omer
In this representation, a 1 at adjacency_matrix[i][j] signifies an edge from node i to node j. For instance, adjacency_matrix[1][3] being 1 represents the edge from Haider to Omer.
Comparison
When comparing the two ways of representing graphs, both methods have their own use cases. Representing a graph using a hash table is a compact way to capture only the existing edges. This approach is memory-efficient as it doesn’t store information about non-existent edges. However, it comes with a drawback: searching for a specific edge can be slower. In a hash table, you must traverse the entire list of edges to determine whether a particular edge exists, resulting in a time complexity that depends on the number of edges, which can be less efficient for larger graphs.
On the other hand, adjacency matrices use more memory but provide a constant-time lookup for edge existence. In an adjacency matrix, we track all potential edges, making it easy to quickly check if an edge exists just by looking at specific positions in the matrix. This constant-time lookup is an advantage, especially when you frequently need to check for edge presence. However, there’s a trade-off: retrieving the neighbors of a node in an adjacency matrix takes linear time O(n), where n is the number of nodes in the graph. This is because you must inspect all possible neighbors in the matrix to find the actual neighbors of a specific node.
Types of Graphs
Directed and Undirected Graphs
In a directed graph, edges have a direction, indicating a one-way relationship between nodes. Each edge has a starting node and an ending node. For example, in the following graph:

Asad is Rabi’s neighbor, but Rabi is not a neighbor of Asad.
In contrast, in an undirected graph, edges have no direction and represent a two-way relationship between nodes. For example, in the following graph:
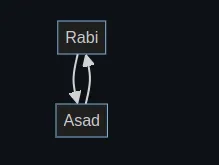
Both Rabi and Asad are neighbors of each other.
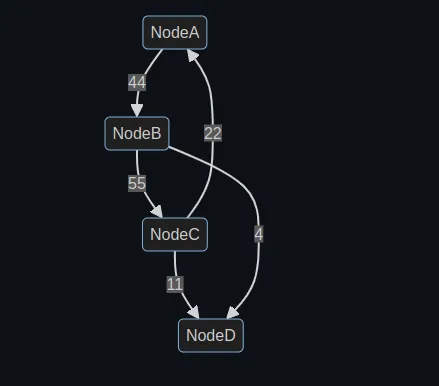
Weighted Graph
A weighted graph assigns a numeric value (weight) to each edge, indicating the strength or cost of the relationship between nodes. For example:
Cyclic and Acyclic Graphs
A cyclic graph contains at least one cycle, which is a path that starts and ends at the same node. Cyclic graphs can be either directed or undirected. Consider this directed graph:
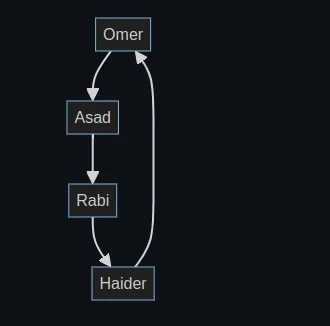
The cycle in this graph goes through the nodes "Omer" -> "Asad" -> "Rabi" -> "Haider" -> "Omer", forming a closed loop.
A graph without any cycles is called an acyclic graph. Consider this example:
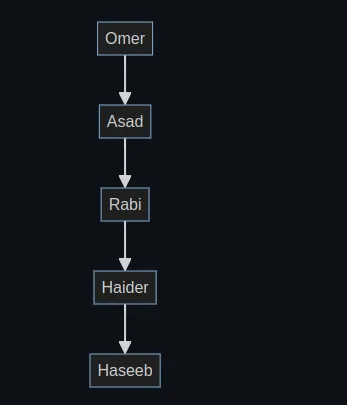
This graph maintains an acyclic structure with no closed loops.

